Archive
- January (22)
- February (24)
- March (22)
- April (21)
- May (23)
- June (21)
- July (23)
- August (23)
- September (21)
- October (23)
- November (21)
- December (20)
Wind Consequences (Part IV – Subsidies and Emissions)
By Kent Hawkins -- September 25, 2012This post is part of a five-part series on the adverse consequences of imposing industrial-scale wind plants on electricity systems. The series shows that there is no valid reason to pursue the policy of implementing new renewable energy sources in electricity generation, especially wind.
This post provides more information on the subsidies and emissions considerations for the scenarios summarized in Part I. Parts II and III dealt with cost implications. Part V this Thursday will focus on a number of other issues providing a complete picture of wind’s undesirability and unfeasibility in all respects.
Part I also provides links to the rest of the series.
Subsidies
Because subsidy issues are often raised, comparing those for wind and other generation plants, it is appropriate to show their effect on a MWh basis, regardless of the absolute amounts.…
Wind Consequences (Part III: Total Costs)
By Kent Hawkins -- September 20, 2012This post completes the determination of wind costs, and Part IV covers subsidization and emissions. Part I, Introduction and Summary, contains links to all the posts in this series.
Just about any analysis you see understates wind’s cost. In fact there can be no comparison between the costs for wind and reliable, dispatchable generation plants such as coal, nuclear and gas plants. Reliability is so important in electricity systems, and wind’s persistent erratic behavior is so problematic that any electricity it produces is not usable and is a threat to electricity system reliability.
Add capacity from reliable generation plants flexible enough to balance wind’s erratic output and a steady, reliable electrical energy flow can be provided. However there is a substantial cost associated with this. As shown in Part II, for wind to produce the same amount of useful, reliable electricity over 40 years, wind and associated balancing overnight plant capital costs are almost 3 times that for nuclear, the most expensive conventional generation plants reviewed.…
Wind Consequences (Part II: Analysis Approach and Implementation Costs)
By Kent Hawkins -- September 18, 2012Part I yesterday provided an introduction and summary of results; this post describes in more detail the analysis approach and implementation costs. Parts III and IV will cover the full costs and other results.
As will be seen, dealing with wind is not as easy as some would suggest.
Analysis Approach
This analysis looks at a 13 year period (years 0-12) in which the demand growth and plant retirement due to obsolescence/age will be each 2% per year compounded. Assuming year 0 is 2012, year 12 is 2025. Table II-1 shows the situation at year 12.
Table II-1 – Year 12 Situation for a Year 0 Demand Level of 1.0 TWh
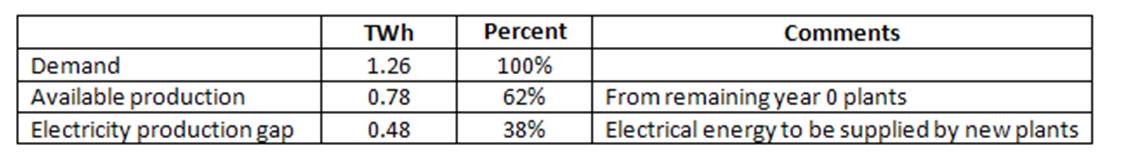
Using demand of 1 TWh in year 0 allows easy scaling for a particular jurisdiction. For example in 2010 the total US electricity production was about 4,000 TWh.…