U.S. Urban Air Pollution Trends: Fossil Fuel Ecology
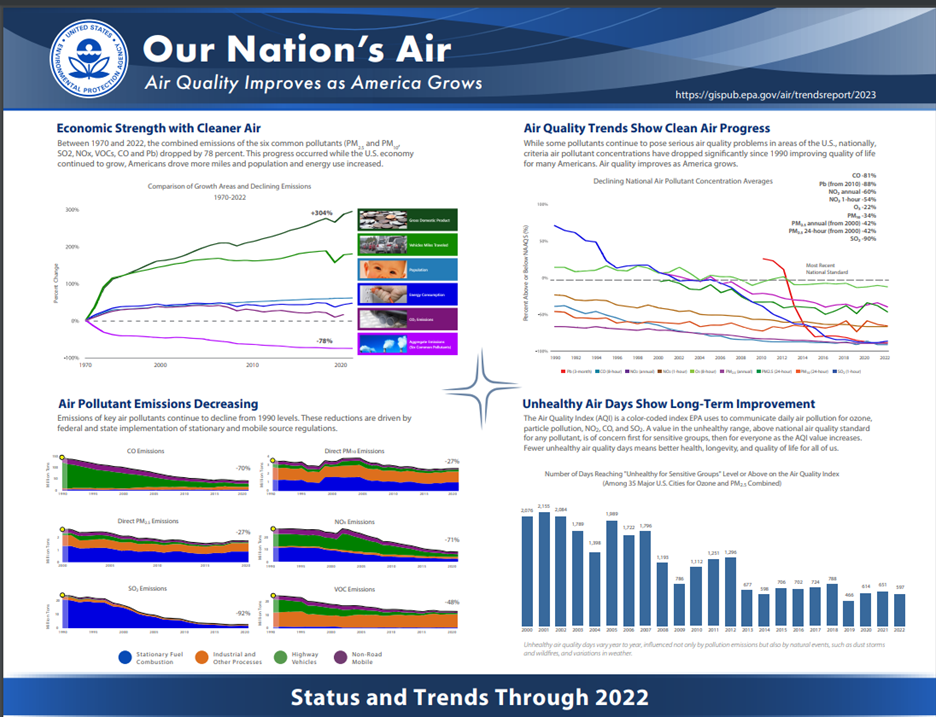
By Robert Bradley Jr. -- July 11, 2024“Between 1970 and 2022, the combined emissions of the six common pollutants (PM2.5 and PM10, SO2, NOx, VOCs, CO and Pb) dropped by 78 percent. This progress occurred while U.S. economic indicators remain strong.” (U.S. Environmental Protection Agency, “Our Nation’s Air Quality: Trends through 2022“)
Having failed to convince skeptics of climate alarm (the science is more settled toward the positives than the negatives of carbon dioxide [CO2]), and with no change in climate policy able to affect climate for decades (if ever), critics of fossil fuels turn to the known criteria air pollutants. The common refrain is that such emissions kill (five million annually), as if the sources of those emissions do not save lives—many more lives—by the minute of every day.
But the trend of each of the five criteria pollutants associated with consumer-driven, taxpayer-neutral energies is positive. And more improvement is predicted. The increasing sustainability of fossil fuels is a major theme of political economy, as it has been for decades. Fact: oil, natural gas, and coal are now environmental products, unlike a half century or more ago when air pollutants from mobile and stationary sources were largely uncontrolled.
————-
In the words of U.S. EPA, illustrated by the graph below, “Between 1970 and 2022, the combined emissions of the six common pollutants (PM2.5 and PM10, SO2, NOx, VOCs, CO and Pb) dropped by 78 percent. This progress occurred while U.S. economic indicators remain strong.”
Source: https://gispub.epa.gov/air/trendsreport/2023/#home
“Since 1970, implementation of the Clean Air Act and technological advances from American innovators have dramatically improved air quality in the U.S. Since that time, the combined emissions of criteria and precursor pollutants have dropped by 78%. Cleaner air provides important public health benefits, and we commend our state, local, community and industry partners for helping further long-term improvement in our air quality.
Nationally, concentrations of air pollutants have dropped significantly since 1990:
- Carbon Monoxide (CO) 8-Hour, 81%
- Lead (Pb) 3-Month Average, 88% (from 2010)
- Nitrogen Dioxide (NO2) Annual, 60%
- Nitrogen Dioxide (NO2) 1-Hour, 54%
- Ozone (O3) 8-Hour, 22%
- Particulate Matter 10 microns (PM10) 24-Hour, 34%
- Particulate Matter 2.5 microns (PM2.5) Annual, 42% (from 2000)
- Particulate Matter 2.5 microns (PM2.5) 24-Hour, 42% (from 2000)
- Sulfur Dioxide (SO2) 1-Hour, 90%
- Numerous air toxics have declined with percentages varying by pollutant
Despite increases in air concentrations of pollutants associated with fires, carbon monoxide and particle pollution, national average air quality concentrations remain below the current, national standards.”
Final EPA statement: “Our Nation’s Air Continues to Improve … However, work must continue to ensure healthy air for all communities. EPA and our partners at the state, tribal and local levels will continue to work to address the complex air quality problems we face.” But sound science, not outlier studies, is needed to inform public policy in light of achievable technological change.